Mayday! Mayday! Jobs, Health Care, and Trump’s Tantrum
We need to put an end to Trump’s war spending tax cuts for the wealthy and redirect those monies to public spending, especially social support programs.
Health care has emerged as a major issue in the Democratic presidential nomination contest between former Secretary of State Hillary Clinton and Vermont Senator Bernie Sanders. While Senator Sanders has made single-payer health care, or "Improved Medicare for All," a cornerstone of his presidential campaign, Secretary Clinton has attacked the proposal, claiming that it would lead to higher taxes on ordinary Americans while threatening the coverage gains already achieved under the Affordable Care Act (ACA, or "Obamacare"). In fact, Improved Medicare for All would substantially reduce health care costs (especially for low- and middle-income families), expand coverage, and improve access to care.

Under the Sanders program, virtually all medical bills in the United States would be paid by a single public agency using funds transferred from existing government health programs and from some new (mostly progressive) taxes. By reducing administrative waste and negotiating for lower drug prices, the Sanders program would be able to reduce the growth in national health care spending, even while extending coverage to all and eliminating all premiums, copayments, and deductibles of the existing system.
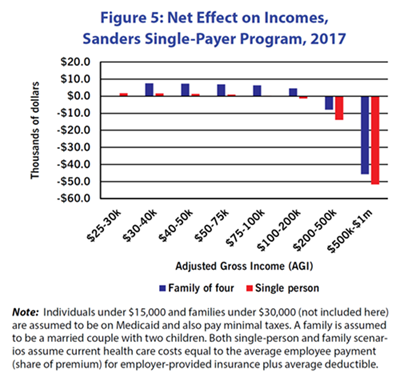
Improved Medicare for All would reduce costs relative to the current system. (See Figure 1.) The Sanders program would reduce national health care spending by increasing the efficiency of billing, reducing insurance-related costs, and negotiating lower drug prices. It would also incur additional expenses by covering the 30 million residents who are currently uninsured, by reducing the barriers to access to health care coming from premiums, deductibles, and copayments, and by raising reimbursement rates to physicians and hospitals.
Overall, there would be nearly $700 billion in savings the first year, partially offset by nearly $400 billion in additional spending, for a net effect of nearly $300 billion in savings relative to the current system.
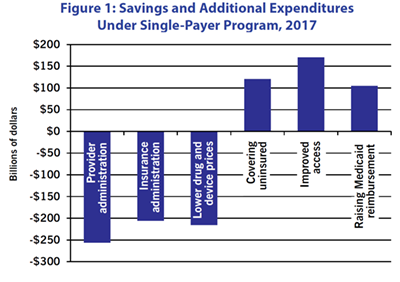
The single-payer program produces two types of savings. (See Figure 2.) In the United States, over the period 1971-2015, health care prices rose at an annual rate 1.75 percentage points faster than non-health prices, largely because of rapidly rising drug prices and growing administrative burdens. In Canada, under single-payer, health care prices have risen at an annual rate only 0.25 percentage points faster than non-health prices. When this slower price growth is layered on top of the immediate efficiency savings, the projected trends in health care spending look far more manageable than if we follow our current trajectory.
Under the current system, health care spending is projected to rise to over 21% of GDP in the period 2017-2026. Even with a single payer program, health care costs would increase to almost 18% of GDP, but these increases would provide more health care services to more people, rather than spending more each year for the same inadequate care.
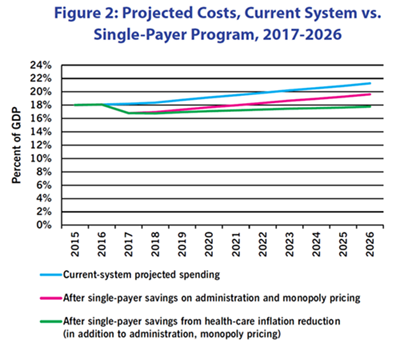
The financing for Improved Medicare for All would come from various sources, not just new taxes. (See Figure 3.) Compared to costs under the current system (first bar), the Sanders single-payer program will achieve efficiency savings and slow the growth in health care inflation. It will pay for these reduced overall costs (second bar) through a combination of reallocating public funds currently spent on health care (including "tax expenditures" currently granted to subsidize employer-provided private health insurance) and new taxes (including a 6.2% tax on payrolls and a series of new taxes which are progressive in their overall effect; third bar).
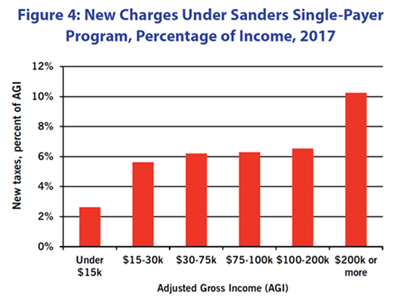
New charges would fall most heavily on the top 1%. (See Figure 4.) Sanders' proposed revenue program is highly progressive, with the heaviest burden falling on high-income and very-high-income households. Looking here just at where new tax burdens fall (and not at reduction in households' existing health expenses): The payroll tax and a 2.2% across-the-board income tax surcharge would be borne by most taxpaying households. However, the other tax changes--taxing capital gains at the same (higher) rate as ordinary income, raising the tax rate on large estates, capping deductions claimed by high-income taxpayers, and increasing the tax rate on top incomes--would fall on those most able to pay.
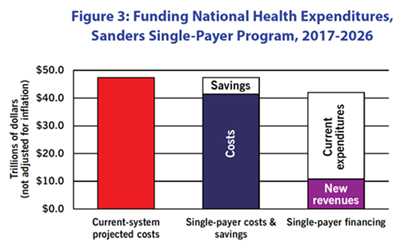
Lower- and middle-income people would benefit from cost reduction under single-payer. (See Figure 5.) This graph describes an individual or family of four that pays the employee portion of the premium for employer-provided insurance and that uses their health coverage at least up the amount of the deductible. So their total health-care costs are equal to their premium plus the deductible. (The Milliman Medical Index for 2015 puts health expenses for a "typical" family of four with employer-provided PPO health insurance at over $10,000 per year. The method here gives a more modest total, about $8,000.)
Under single payer, individuals and families would no longer face costs like insurance premiums or out-of-pocket expenses up to their deductible. They would face additional taxes. In the scenario described here, though, for lower- and middle-income people the reduction in their costs would be greater than the added taxes they would pay, so they would experience a net financial benefit.