This article is from Dollars & Sense: Real World Economics, available at http://www.dollarsandsense.org

This article is from the
September/October 2015 issue.
Subscribe Now
at a 30% discount.
Economy in Numbers
The Burdens of American Federalism
Income Redistribution Through Taxation
Economic inequality has been on the rise for several decades: Income has become more concentrated at the top, and the share of income going to workers as wages has declined while the share captured as profits and other forms of property income has risen. Many scholars and activists have looked at tax policy both for changes that may explain widening income gaps and for reforms that might reduce inequality of market incomes. While it is appropriate to study the role of federal taxes, state and local governments take in nearly half of all government revenue, and non-tax revenues from fees and service charges account for nearly 15% of government revenue (all levels).
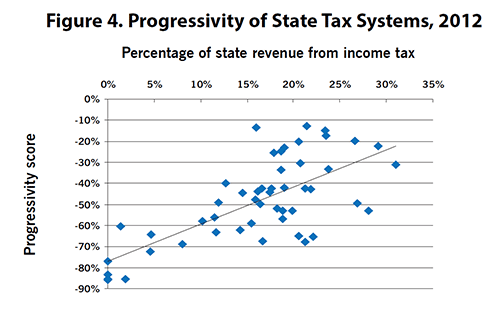
Americans are accustomed to thinking of the tax system as progressive, requiring higher-income people to pay a higher percentage of their incomes in taxes than lower-income people. Because the burden of state and local taxes and non-tax revenues is much heavier on poor people and the working class than it is on the rich, however, the fiscal system as a whole is much less progressive than it seems from looking only at federal-level taxation. While all states have regressive tax systems, requiring lower-income people to pay a higher percentage of their incomes than higher-income people, some states are more regressive than others. States that rely on sales taxes and user fees impose a heavier burden on poor and working people; states that rely more on income taxes do less to widen the income gap.
The federal government collects only a little more than half of government revenues. The federal government and its taxes—totaling nearly $2.6 trillion (or 56% of government revenue)—have often been the focus of political attention and controversy. State and local governments, however, collect nearly $2 trillion in taxes and other types of revenue. (Non-tax revenue includes charges for services (such as water, the lottery, or college tuition) as well as fees (such as motor vehicle registrations or licenses).) States and localities collect 44% of total government revenues. Therefore, to understand the distributional impact of government revenue policies in the United States, we have to consider all levels of government, not just the federal.

Federal revenues are collected largely from income and payroll taxes; states and localities collect sales and property taxes, and charge fees. There are three distinct tax systems in the United States, corresponding to the three levels of government. The federal government draws the vast majority of its revenue from taxes on income, including corporate and personal income taxes as well as Social Security and Medicare payroll taxes. In contrast, income taxes account for less than 30% of state tax revenue and virtually no local tax revenue. States also rely on revenue from fees and from sales taxes, especially on material goods. (Business and consumer services usually go untaxed.) For their part, local governments rely little on sales taxes but draw most of their revenue from fees and from property taxes, mostly on real estate.

The economic burden of state and local government falls most heavily on poor and working people. Most Americans pay more in state and local government taxes and fees than they do in federal taxes. Because federal taxes fall more heavily on the rich than on the poor, they redistribute income “downwards.” In contrast, state and local taxes and fees fall more heavily on the poor and the working class, while the richest Americans pay relatively little. (Property taxes, significant at the local level, are actually regressive on balance: The Institute for Taxation and Economic Policy calculates the bottom 20% pay 3.7% of their incomes in property taxes, while the richest 1% pay only 1.6%.) The larger the share of state and local taxes and fees—apart from income taxes—the less government redistributes income downward; the larger the share of national taxation, the more the government does to equalize after-tax incomes.

States that rely on income taxes have more equitable tax systems. Whether assessed on the state level or on the national level, income taxes fall more heavily on the rich than on the poor. Because of federal and state earned-income tax credits (tax exemptions on labor income that favor low-income people) and progressive income-tax rates, high-income people pay a much higher percentage of their incomes in income taxes than do lower-income people. By contrast, sales taxes fall more heavily on lower-income people. States without an income tax, like Texas, Washington, and Wyoming, or states where relatively little revenue comes from the income tax, have the most regressive revenue systems. By contrast, the states with the least regressive systems tend to rely more on income taxation and draw less of their revenue from sales taxes and fees.

Did you find this article useful? Please consider supporting our work by donating or subscribing.
