Who Votes, and How?
This article is from the January/February 2004 issue of Dollars and Sense: The Magazine of Economic Justice available at http://www.dollarsandsense.org
This article is from the January/February 2004 issue of Dollars & Sense magazine.
Subscribe Now
at a discount.
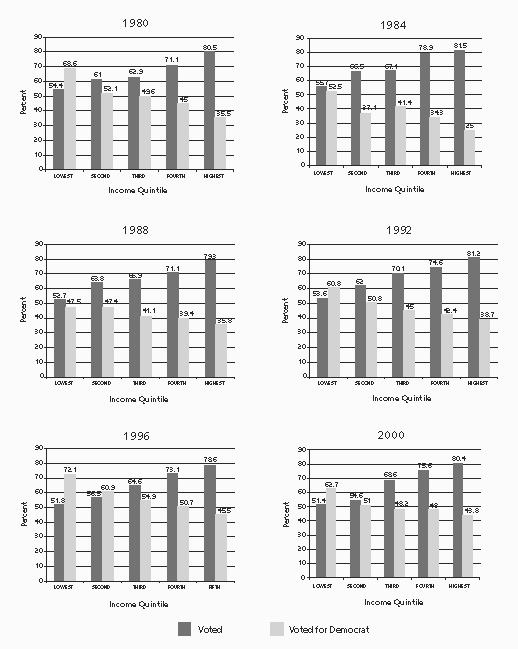
Of the last four presidential elections won by the Republican candidate, the two closest ones (in 1980 and 2000) would have gone to the Democrat had lower-income people voted in the same percentages as higher-income groups. So suggests an analysis of data from the General Social Survey, a personal interview survey of a representative sample of U.S. households conducted regularly by the National Opinion Research Center at the University of Chicago.
In 2000, a majority of voters in the lowest four out of five income quintiles reported choosing the Democratic candidate. In 1980, a majority of voters in three out of five income quintiles reported choosing the Democratic candidate, and the fourth quintile was nearly tied. Low- and middle-income people are far less likely to vote, however. As the table shows, the GSS data suggest that there is typically a 25 to 30 percentage-point gap in participation between the lowest and highest income quintiles. The data for every election show a clear pattern: turnout and the portion of the vote going to the Republican candidate both rise as income increases.
Of course, these figures do not take into account the electoral college, with its complex state-by-state calculus. Electoral college results can be lopsided compared to popular-vote results. For example, readers who recall the 1980 election as a rout are remembering the electoral college result, where Reagan won 489 out of 538 votes; the popular vote was much closer (50.9% to 41.1%). Still, it is highly unlikely for a presidential candidate who wins the popular vote to lose the election, and this complication is of course irrelevant for every other elective office. (And, to be sure, income is not the only determinant of voting behavior: race, election-year economic indicators, and hot-button issues like abortion all play a role, among other factors.)
In any case, "New Democrats," led by the folks at the Democratic Leadership Council (DLC), are banking on the persistance of this turnout gap. The New Democrats are the wing of the Democratic Party that came into ascendancy in the 1990s, claiming credit for helping Bill Clinton win election twice by shaping his "centrist" agenda. DLC director Al From and his colleagues regularly ridicule the strategy of trying to activate low- and middle-income nonvoters. Instead, they argue, Democrats should offer a moderate program designed to appeal to suburban voters—the famous soccer moms (and office-park dads). Thus the DLC program: liberal on certain social issues (abortion rights, gun control), fiscally conservative, pro-business. In the run-up to the 2002 congressional elections, the DLC warned Democratic candidates to avoid "economic populism" and to "be vigilant against 'populist' efforts to exploit the corporate scandals." The DLC stance may appeal to some suburban voters; it certainly appeals to the corporate funders on whom the DLC and the party depend.
These data on voting patterns suggest, however, that Democratic candidates could benefit from engaging the large pool of low- and middle-income nonvoters. Easier voter registration and time off to vote would be a start, although the 1993 National Voter Registration Act ("motor voter"), requiring states to make voter registration a part of the drivers license application process, has not had the overall positive effect on voter turnout that many hoped. (But note the experiences of Wisconsin, which has same-day voter registration, and North Dakota, which does not require registration at all—both typically rank very high in turnout.)
Making it easier to vote isn't enough. Nonvoters need a reason to vote, and this is where the "economic populism" so reviled by the DLC fits in—taking on corporate power, reforming labor law, slowing and reshaping the free-trade juggernaut, returning to a more progressive tax structure. Writing last year in Dissent, Benjamin Ross noted that while DLC-ers often point to George McGovern's 1972 loss as the nightmare result of a Democrat moving too far to the left, the "New Democrat" strategy actually has a lot in common with the McGovern campaign: both give up on white, working-class voters and organized labor, hoping instead to win with a coalition of upscale suburbanites plus African Americans and other ethnic minorities. But as Ross suggested, economic-populist policies have the potential to appeal in different ways to all of these groups: "Today, there is the organized corruption of campaign finance and the malfeasance of the Enrons and Worldcoms. These issues engage the moral indignation of the affluent and educated—in the case of stock market scandals, their pecuniary interests too. And a focus on such matters is no impediment, to say the least, to winning votes among the working class."
Voting in Presidential Elections by Income

Sources: James Allan Davis and Tom W. Smith, General Social Surveys, 1972-2002, Chicago: National Opinion Research Center; The NES Guide to Public Opinion and Electoral Behavior, Ann Arbor, Mich.: University of Michigan, Center for Political Studies, 1995-2000, www.muich.edu/~nes; U.S. Census Bureau, Historical Income Tables - Households, www.census.gov/hhes/income/histinc/h01.html; Analyzed at http://sda.berkeley.edu:7502.
Note: As these data derive from surveys, they are not identical to actual turnout and election result figures. Survey data typically overreport voter turnout. For example, the GSS data show 64.7% of the voting-age population reported voting in 2000, as compared to the actual turnout of 51.3%. The Census Bureau's Current Population Survey (CPS) and the University of Michigan's National Election Studies (NES) also overreport voter turnout. The CPS and NES data, however, show the same pattern of rising turnout corresponding with rising income as the GSS data. For 2000, for example, the CPS shows voter turnout ranging from about 35% for the lowest income quintile to about 71% for the highest. With respect to vote choice, we saw no clear pattern or bias in the differences between the GSS and NES data and the actual election outcomes. In some years, respondents reported a higher Democratic vote than in the actual vote; in other years, they reported a higher Republican vote. In some years, respondents reported a higher vote for the winning candidate than the actual vote; in other years they reported a higher vote for the losing candidate.
