

Criminal Inequality: Progressives Are Not Guilty
This article is from Dollars & Sense: Real World Economics, available at http://www.dollarsandsense.org
This article is from the
May/June 2016 issue.
Subscribe Now
at a 30% discount.
Hillary Clinton and Bernie Sanders are promising all types of programs to make America a more equal country. But when you look at performance and not rhetoric, the administrations of political progressives have made the distribution of income more unequal than their adversaries, who supposedly favor the wealthy.
Inequality rose more under Bill Clinton than under Ronald Reagan. Barack Obama’s administration follows this pattern...The Gini index rose more than three times as much under Mr. Obama than under Mr. Bush. In 1968, government transfer payments totaled $53 billion or roughly 7% of personal income. By 2014, these had climbed to $2.5 trillion—about 17% of personal income. Despite the redistribution of a sixth of all income, inequality measured is far higher today than in 1968.
—Lawrence B. Lindsey, “How Progressives Drive Income Inequality,” Wall Street Journal, March 4, 2016.
Progressives have the perfect alibi when it comes to the criminal levels of inequality of the last four decades. They were never at the scene of the crime.
But Lawrence Lindsey was. As an economic advisor to George W. Bush, he had a hand in the policies that sustained unprecedented inequality, which has worsened during Republican and Democratic presidential administrations alike. If the only charge Lindsey leveled had been that inequality got worse during Democratic and Republican administrations, then there would be little to disagree with. But using a mishmash of data and misleading arguments, Lindsey attempts pin the crime of worsening inequality on progressives—arguing that redistribution policies, government taxes and transfer payments, make inequality worse, not better. Now that’s just not so.
The names on the most-wanted posters for driving income inequality should not be progressives but those who enacted pro-rich tax cuts, deregulated finance, slashed public services, supported anti-worker changes in labor relations, and enacted disastrous trade agreements—the policies that saddled us with ever-worsening inequality and put the livelihoods of so many at risk.
But let’s take a closer look at why Lindsey’s claim that progressives drive income inequality should be dismissed as nothing more than a nuisance suit.
Mistaken Identity
Incapable of picking out a progressive from a lineup, Lindsey assumes that every Democratic president must one. If only it were true.
Now Lindsey’s confusion is not all his fault. After all Hillary Clinton has called herself both “a moderate” and “a progressive who likes to get things done.”
But what is a “progressive”? The original Progressives were turn-of-the-twentieth-century reformers who advocated using an expansive government to counteract the excesses of industrial and financial capitalism. Today, progressive economic change consists in altering the power relations that created the gaping inequalities of our economy. That means providing universal access to health care, to education (from pre-K through college), and to a decent retirement; reigning in the power of finance; forcing the super-rich to pay their fair share of taxes; and empowering workers through full-employment policies and the enforcement and strengthening of labor laws.
By those standards, Bill Clinton was no agent of progressive change. The Clinton administration did raise the top income tax bracket and increase the minimum wage. But Clinton abandoned his campaign promise to “put people first” in favor of balancing the budget. Federal government spending as a percentage of GDP fell to its lowest level anytime since the mid-1960s. Spending on supports for poor families, including food stamps and nutrition programs, also fell relative to GDP. And in his 1996 State of the Union Address, Clinton declared that “the era of big government is over.” Clinton led the charge to “end welfare as we know it,” deregulate the financial industry, and to enact the North America Free Trade Agreement (NAFTA). It is hardly surprising that the Census Bureau measures show inequality rising during the Clinton years even more quickly than during the Reagan years.
The Obama administration has had its share of economic policy successes, including a stimulus program that helped stave off a second Great Depression, the Affordable Care Act, and an increase in the minimum wage. Still, Obama never proposed a large enough stimulus package to push the economy toward full employment and produce healthy wage gains. While the Affordable Care act expanded health insurance coverage, the administration never challenged the employer-provided insurance system nor fought for reforms (like a single-payer system) that would make health care a universal right. The Obama administration bailed out the financial industry. And, while the Dodd Frank Act created the Consumer Financial Protection Agency, the new regulation hasn’t created the fundamental change necessary to rein in the financial sector or prevent another crisis. Now, in its closing year, the Obama administration is pushing to enact yet another pro-corporate trade pact, the Trans Pacific Partnership (TPP).
Lindsey’s comparison of rising levels of inequality during the Bush and Obama years says little about the policy differences of the two administrations and much more about impact of Great Recession on inequality. Inequality was at its worst in the Bush years at the peak of the housing bubble, and then declined as the housing market and then the financial markets collapsed in the last years for his administration. Inequality levels did not return to their previous peak until 2010, a year after the official end of the Great Recession. Since then, the increase in inequality (as measured by the Census Bureau), under the Obama administration, has been slightly greater than during the Bush administration prior to the collapse of the housing bubble.
Faulty Evidence
But even if Lindsey hadn’t rounded up the wrong suspects, he still would not have shown that progressives drive income inequality. The Census Bureau measures on inequality on which he rests his argument fail to capture much of the effect of government redistribution policies in reducing U.S. inequality.
Take the Gini coefficient, the best known and most widely used of the three measures of inequality Lindsey uses to make his argument. The Gini summarizes the entire distribution of income into a single number that ranges between zero and one. The higher the Gini index the more unequal the distribution of income; the lower the Gini, the more equal. The Census Bureau Gini index measures the degree of inequality of “money income”—pre-tax private cash income (including capital gains) plus government cash transfers (including Social Security, unemployment insurance, and cash public assistance). But it fails to count government “near-cash” transfers (including housing assistance and nutritional programs) and in-kind transfers (including Medicare and Medicaid).
By counting only cash government transfers (not near-cash and in-kind transfers), the Census Bureau measures of inequality fail to account for the impact of nearly one-half of government transfers.
Better Measures
If Lindsey had been truly interested in assessing the effect of redistributive policies, he would have been far better served by comparing the Congressional Budget Office’s (CBO) Gini indexes for market income and after-tax income. The Gini for market income (pre-tax cash income, including capital gains) is a good proxy for market-generated inequality before the redistributive effects of government spending and taxes. CBO after-tax income includes market income, plus government transfers from federal, state, and local government (including cash transfers and near-cash and non-cash transfers such as Medicare and Medicaid), minus federal taxes paid. (See Figure 1.)
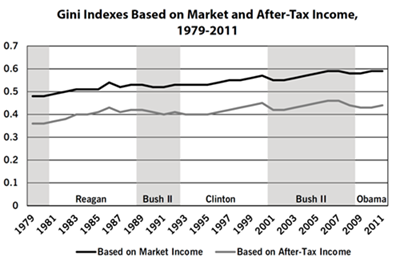
The CBO measures do suffer from two important weaknesses. First, the latest data available are for 2011. Second, the Gini based on after-tax income does not account for the effects of state and local taxes, which are highly regressive, leading the CBO after-tax income Gini to overstate how much taxes reduce inequality.
Overall, however, the difference between the market-income Gini and the after-tax Gini gives a good approximation of the effect of government redistribution on U.S. inequality. On average, in the period from 1979 to 2011, inequality measured on the basis of after-tax income was 23% lower than inequality based on market income. Government transfers accounted for about two-thirds of that reduction and federal taxes for the other third. (See Figure 2. With greater redistribution, the lines in the chart decline, indicating a reduction in inequality.)
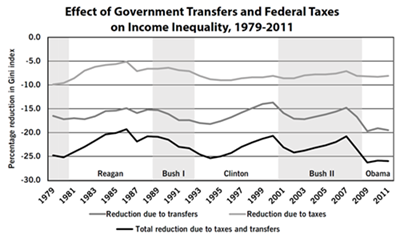
In 1980, federal tax and spending policies reduced market inequality by about one-fourth (25.2%). But after eight years of Reagan’s government bashing policies, that effect was down to just over one-fifth (20.8%).
During the administration of George H.W. Bush, the four years between Reagan and Clinton, the effect of redistribution grew, reaching 23.2% in 1992. But Clinton’s budget slashing policies reduced the redistributive effect of government spending and taxes to 20.7% (slightly lower than at the end of the Reagan years).
During the George W. Bush administration, market inequality and after-tax inequality continued to increase, though more slowly than under Reagan and Clinton. By 2007, government tax and spending policies were doing no more to reduce inequality as they had at the end of the Reagan and Clinton administrations, cutting inequality by just over one fifth, 20.7% in 2000 at the beginning of the Bush years and 20.8% in 2007. And the following year, with the onset of the Great Recession, government transfers such as unemployment insurance, food stamps, and the Supplemental Nutrition Assistance Program (SNAP) increased even more than they had during the much milder 2001 recession at the beginning of the Bush administration.
In 2011, after the first three years of the Obama administration, inequality of CBO market incomes was back up to its 2007 level, but inequality of after-tax income remained 6% below its 2007 peak. (Unfortunately, the CBO data end in 2011.)
In the years since, inequality has been on the rise according to the Census Bureau’s Gini index. The stock market bubble and the absence of solid wage gains testify to that worsening inequality. But with the effects of nearly half of government transfers (including health transfers) not accounted for in the Census Bureau measure, at this point it is not possible to say whether after-tax income is still more equal than it was at the onset of the Great Recession.
Looking Elsewhere for Progressive Policies
One thing remains clear: no matter how it is measured, whether by market income, money income, or after-tax income, U.S. inequality has reached monstrous portions. Genuinely progressive policies are called for to arrest and reverse this worsening inequality.
Looking for genuinely progressive policies means looking outside the United States. According to OECD estimates (which differ somewhat from the CBO estimates), U.S. government transfers and taxes reduced the Gini about one-quarter (24.4%) in 2011 in the wake of Great Recession, much more than it had just four years earlier. But even that amount was considerably less than the one-third-plus reduction (34.4%) in the Gini accomplished by government transfers and taxes the average for the 34 OECD countries—leaving U.S. inequality at levels about one-fourth higher than the OECD average. In Denmark, taxes and government transfers do nearly twice as much to reduce inequality than U.S. taxes and government transfers do to reduce the considerably higher level of inequality in the United States. And intergenerational economic mobility is much greater in Denmark than in the United States, where (using the most common measure of economic mobility) the income of a father has three times the influence on the adult economic position of a son than it does in Denmark.
On those counts, reducing inequality and promoting social mobility, progressives are guilty. And damn proud of it.
Did you find this article useful? Please consider supporting our work by donating or subscribing.