This article is from Dollars & Sense: Real World Economics, available at http://www.dollarsandsense.org

This article is from the July/August 2011 issue of Dollars & Sense magazine.
Nearly $2 Trillion Purloined from U.S. Workers in 2009
In 2009, stock owners, bankers, brokers, hedge-fund wizards, highly paid corporate executives, corporations, and mid-ranking managers pocketed—as either income, benefits, or perks such as corporate jets—an estimated $1.91 trillion that 40 years ago would have collectively gone to non-supervisory and production workers in the form of higher wages and benefits. These are the 88 million workers in the private sector who are closely tied to production processes and/or are not responsible for the supervision, planning, or direction of other workers.
From the end of World War II until the early 1970s, the benefits of economic growth were broadly shared by those in all income categories: workers received increases in compensation (wages plus benefits) that essentially matched the rise in their productivity. Neoclassical economist John Bates Clark (1847-1938) first formulated what he termed the “natural law” of income distribution which “assigns to everyone what he has specifically created.” That is, if markets are not “obstructed,” pay levels should be “equal [to] that part of the product of industry which is traceable to labor itself.” As productivity increased, Clark argued, wages would rise at an equal rate.
The idea that compensation increases should equal increases in average labor productivity per worker as a matter of national wage policy, or a wage norm, is traceable to the President’s Council of Economic Advisors under the Eisenhower and Kennedy administrations. This macroeconomic approach was anchored in the fact that if compensation rises in step with productivity growth, then both unit labor costs and capital’s versus labor’s share of national income will remain constant. This “Keynesian Consensus” never questioned the fairness of the initial capital/labor split, but it at least offered workers a share of the fruits of future economic growth.

Sources and Calculations:
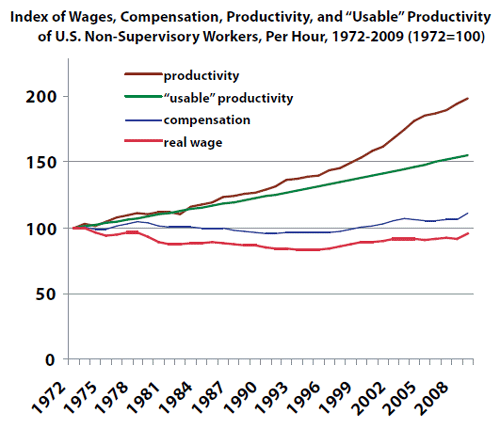
This calculation is based on the 1972 average real hourly wage expressed in 2009 dollars, $17.88, plus $2.95 per hour in benefits, with total compensation [wages + benefits] equal to $20.83 per hour for non-supervisory workers (U.S. Department of Labor, 2010a, 2010b: 85-90; Economic Policy Institute, 2011). The growth of private productivity from 1972 to 2009 was 92.7%. Adjusting the productivity figure (downward) to account for lower economy-wide productivity, consistent deflation in both producer prices and consumer prices, and a rising rate of depreciation, the net growth of “usable” productivity was 55.5% (Baker 2007). If workers had been paid the value of their annual productivity increases (as they essentially were prior to the early 1970s) they would have received an average of $35.98 per hour in compensation in 2009 instead of the $23.14 they actually received. The differential was $12.84. Workers worked an average of 39.8 hours per week in 2009, so $511 of compensation that they would have received under conditions prior to the early 1970s instead was diverted. On an annual basis of 1,768 hours worked per year, according to the OECD, each worker lost to capital an average of $22,701. Adjusting the 88,239,000 production and non-supervisory workers employed in 2009 to the lower 1972 labor force participation rate equivalent of 84,180,000 workers, the total of purloined workers’ compensation for 2009 comes to $1.91 trillion (Council of Economic Advisors, 2010: Tables B-47, B-49; U.S. Department of Labor, Bureau of Labor Statistics, 2011 Table B-6).
As the figure below shows, both Clark’s idea of a “natural law” of distribution and Keynesian national wage policy have ceased to function since the onset of the neoliberal/supply-side era beginning in the early 1970s. From 1972 through 2009, “usable” productivity—that part of productivity growth that is available for raising wages and living standards—increased by 55.5%. Meanwhile, real average hourly pay fell by almost 10% (excluding benefits). As a group, workers responded by increasing their labor-force participation rate. To make the calculation consistent over time, employment is adjusted to a constant participation rate set at the 1972 level. Had compensation matched “usable” productivity growth, the (adjusted) 84 million non-supervisory and production workers in 2009 would have received roughly $1.91 trillion more in wages and benefits. That is, 13.5% of the nation’s Gross Domestic Product in 2009 was transferred from non-supervisory workers to capitalists (and managers) via the gap of 44.4% that had opened up between compensation and “usable” productivity since 1972.
As expected, neoclassical (or mainstream) economists offer tortured justifications for the new status quo. The erstwhile dauphin of neoclassical economics, Harvard economist Gregory Mankiw agrees with Clark’s formulation. But he says that even though “productivity has accelerated, workers have become accustomed to the slow rate of wage growth since the 1970s.” Why “accustomed”? Well, believe it or not, neoclassical economists claim that today’s workers suffer from “low wage aspirations.” Mankiw equates the wage that workers aspire to with the wage they consider fair. So, according to this very strange formulation, workers consider that they are getting a fair shake today, even though their compensation increases lag behind their productivity increases. Yet a few decades earlier, they considered it fair (as did Clark and Mankiw) for compensation growth to keep up with productivity increases.
Some economists simply deny that any change has occurred. Noted neoclassical conjurer Martin Feldstein believes that the “productivity-compensation gap” is merely a matter of bad measurement: by dropping the Consumer Price Index as the appropriate yardstick, Feldstein alchemically transforms the way wages are adjusted for inflation. His soothing Panglossian recalibration raises workers’ “real” income; et voilą!—the productivity-compensation gap all but disappears.
Leaving aside such statistical prestidigitation, a vast upward transfer of income is evident. That transfer is directly related to the rupture of the so-called “Treaty of Detroit”—an understanding between capital and labor, pounded out during the Truman administration, wherein employers accepted the idea that compensation could grow at the rate that productivity increased. In 1953 union strength was at its high point; 32.5% of the U.S. labor force was unionized. With the profit squeeze of the early 1970s and the onset of Reaganism, unionization rates began to fall—to 27% in 1979, then to 19% in 1984. By 2010 the rate was down to 11.9% (and only 6.9% in the private sector). Off-shoring, outsourcing, vigorous (and often illegal) corporate tactics to stop unionization drives, and an overall political climate of hostility to free and fair union elections have deprived workers of the countervailing power they once held. The result is that without unions struggling to divide the economic pie, non-supervisory and production workers (78% of the private-sector workforce) have been deprived of a minimal level of economic distributive justice.
The upward redistribution has remained as hidden as possible. The forms it has taken—as bonuses, bloated salaries, elephantine stock options, padded consulting fees, outsized compensation to boards of directors, sumptuous conferences, palatial offices complete with original artwork, retinues of superfluous “support” staff, hunting lodges, private corporate dining rooms, regal retirement agreements, and so on—defy exact categorization. Some would appear as profit, some as interest, some as dividends, realized capital gains, gigantic pension programs, retained earnings, or owners’ income, with the remainder deeply buried as “costs of doing business.”
In the final analysis, the $1.91 trillion figure is only an approximation, designed to make more concrete a concept that has lacked an important quantitative dimension. Of course, had compensation increases matched “usable” productivity increases, workers would have paid taxes on the wage portion of their compensation, leaving them with much less than the $1.91 trillion in their pockets. Meanwhile, as these funds are shifted over to capital (and management salaries), federal, state, and local taxes are paid on the portion which appears as declared income. This results in a considerable drop in the net after-tax transfer amount actually pocketed by capital through their appropriation of the productivity increases of non-supervisory workers. Even so, their haul remains a staggering—even astonishing—sum.
Did you find this article useful? Please consider supporting our work by donating or subscribing.
