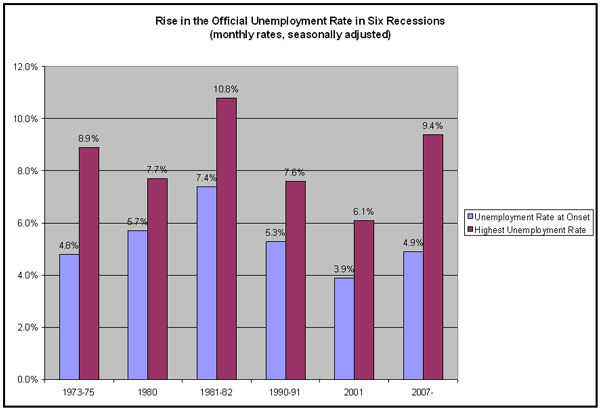
Source: Table A-1, Bureau of Labor Statistics, U.S. Labor Department, www.bls.gov.
Although you have to dig into the statistics to know it, unemployment in the United States is now worse than at any time since the end of the Great Depression.
From December 2007, when the recession began, to May of this year, 6.0 million U.S. workers lost their jobs. The big three U.S. automakers are closing plants and letting white-collar workers go too. Chrysler, the worst off of the three, will lay off one-quarter of its workforce even if it survives. Heavy equipment manufacturer Caterpillar and giant banking conglomerate Citigroup have both laid off thousands of workers. Alcoa, the aluminum maker, has let workers go. Computer maker Dell and express shipper DHL have both canned many of their workers. Circuit City, the leading electronics retailer, went out of business, costing its 40,000 workers their jobs. Lawyers in large national firms are getting the ax. Even on Sesame Street, workers are losing their jobs.

Source: Table A-1, Bureau of Labor Statistics, U.S. Labor Department, www.bls.gov.
The official unemployment rate hit 9.4% in May—already as high as the peak unemployment rates in all but the 1982 recession, the worst since World War II. And topping the 1982 recession’s peak rate of 10.8% is now distinctly possible. The current downturn has pushed up unemployment rates by more than any previous postwar recession (see Table 1).
The BLS calculates the official unemployment rate, U-3, as the number of unemployed as a percentage of the civilian labor force. The civilian labor force consists of employed workers plus the officially unemployed, those without jobs who are available to work and have looked for a job in the last 4 weeks. Applying the data found in Table 2 yields an official unemployment rate of 9.1%, or a seasonally adjusted rate 9.4% for April 2009.
The comprehensive U-6 unemployment rate adjusts the official rate by adding marginally attached workers and workers forced to work part time for economic reasons to the officially unemployed. To find the U-6 rate the BLS takes that higher unemployment count and divides it by the official civilian labor force plus the number of marginally attached workers. (No adjustment is necessary for forced part-time workers since they are already counted in the official labor force as employed workers.)
Accounting for the large number of marginally attached workers and those working part-time for economic reasons raises the count of unemployed to 24.0 million workers for May 2009. Those numbers push up the U-6 unemployment rate to 15.9% or a seasonally adjusted rate of 16.4%.
Some groups of workers are already facing official unemployment rates in the double digits. As of May, unemployment rates for black, Hispanic, and teenage workers were already 14.9%, 12.7% and 22.7%, respectively. Workers without a high-school diploma confronted a 15.5% unemployment rate, while the unemployment rate for workers with just a high-school degree was 10.0%. Nearly one in five (19.2%) construction workers were unemployed. In Michigan, the hardest hit state, unemployment was at 12.9% in April. Unemployment rates in seven other states were at double-digit levels as well.
As bad as they are, these figures dramatically understate the true extent of unemployment. First, they exclude anyone without a job who is ready to work but has not actively looked for a job in the previous four weeks. The Bureau of Labor Statistics classifies such workers as “marginally attached to the labor force” so long as they have looked for work within the last year. Marginally attached workers include so-called discouraged workers who have given up looking for job-related reasons, plus others who have given up for reasons such as school and family responsibilities, ill health, or transportation problems.
Second, the official unemployment rate leaves out part-time workers looking for full-time work: part-time workers are “employed” even if they work as little as one hour a week. The vast majority of people working part time involuntarily have had their hours cut due to slack or unfavorable business conditions. The rest are working part time because they could only find part-time work.
To its credit, the BLS has developed alternative unemployment measures that go a long way toward correcting the shortcomings of the official rate. The broadest alternative measure, called “U-6,” counts as unemployed “marginally attached workers” as well as those employed “part time for economic reasons.”
When those adjustments are taken into account for May 2009, the unemployment rate soars to 16.4%. That is the highest rate since the BLS began calculating the U-6 rate in 1994. While not exactly comparable, it is also higher than the BLS’s earlier and yet broader adjusted unemployment rate called the U-7. The BLS began calculating the U-7 rate in 1976 but discontinued it in 1994 in favor of the U-6 rate. In the 1982 recession the U-7 reached 15.3%, its highest level. In fact, no bout of unemployment since the last year of the Great Depression in 1941 would have produced an adjusted unemployment rate as high as today’s.

Why is the real unemployment rate so much higher than the official, or U-3, rate? First, forced part-time work has reached its highest level ever, going all the way back to 1956 and including the 1982 recession. In May 2009, 8.8 million workers were forced to work part time for economic reasons. Forced part-timers are concentrated in retail, food services, and construction; about a quarter of them are young workers between 16 and 24. The number of discouraged workers is high today as well. In May, the BLS counted 2.2 million “marginally attached” workers. That matches the highest number since 1994, when the agency introduced this measure.
With the economy in the throes of a catastrophic downturn, unemployment, no matter how it’s measured, will rise dramatically and impose yet more devastating costs on society and on those without a job or unable to find full-time work.
Did you find this article useful? Please consider supporting our work by donating or subscribing.