
Debt levels in today's economy have reached historic levels, exceeding even the levels on the eve of the Great Recession of the last decade. For instance, current corporate, household, and government debt total $39.3 trillion, compared to "just" $16.6 trillion in 2003. The high levels of debt are in the news and are of international concern. This primer examines the types of debt in the United States and puts them in perspective with relation to the overall economy.
First off, what do we mean by "debt"? Debt is created when a company, individual, or government takes out a loan, sells a bond, or in any way enters into an agreement to pay money back, usually with interest. All kinds of people and institutions borrow: including individuals, households, banks, private companies, and governments.
Debt is complex and comes in different forms. Economists divide debt into four main types: nonfinancial corporate debt, financial corporate debt, personal or household debt, and government debt. The types of debt reflect the types of borrowers. They are quite different in their effects on the economy and their importance in understanding how they may lead to a crisis. Examining each of the different types of debt will help us understand their impact on the economy. For instance, nonfinancial corporate debt has historically been based in the "real" economy (e.g., the production and distribution of goods and services). Financial debt, which is increasingly also taken on by nonfinancial institutions, can have profound effects, for instance on credit markets, which affect the real economy and can lead to economic crisis. Governmental debt impacts both the real economy and financial markets such as the stock market and the market for bonds, mortgages and other securities. As personal debt grows, it affects the standard of living of the people or households that take on debt.
Nonfinancial Corporate Debt
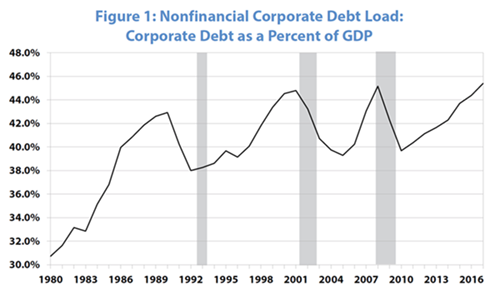
Nonfinancial corporate debt (see Figure 1) has historically been used by corporations to fund production through what is called "productive investment," which includes investments in buildings, machines, and inventories. Nonfinancial corporate debt has increased more than tenfold since 1980, when it was less than a trillion dollars. By 1990, it was $2.6 trillion, by 2000, $4.7 trillion, by 2008 it had reached $6.5 trillion, and today it is about $10 trillion. The amount of nonfinancial corporate debt has increased far faster than the economy has grown. The ratio of nonfinancial corporate debt to the Gross Domestic Product (GDP) today stands at 48.6%, the highest it has been in 60 years. A report by Matt Egan of CNN points out that the richest 1% of corporations carry more than half of this debt, with the largest seven companies controlling something on the order of 12.5%.
Instead of investing productively, too much of today's corporate debt is used to buy back financial instruments to maintain stock prices and profitability. For example, a fair amount of corporate debt is spent on buying the company's own stock to drive the price up and reward shareholders. Financial investments often yield a higher return than productive investments, further increasing profitability. These actions have led to a decrease in productive investment and are a reason (though not the only one) for the decline in productivity growth in the productive sector. The rest of the corporate debt is held by smaller companies that do not have the wherewithal to maintain the load they are carrying. This has meant that they have a very large interest payment burden. In 2018, for example, corporations carried $8 of debt for every $1 of cash they had on hand. That is a worse situation than the debt level in the 2008 crisis. If the situation develops where this debt cannot be paid, that can lead to an economic crisis (and it has in the past). For example, the peaks in borrowing shown in Figure 1 correspond to the recessions of 1990-1991, 2001 (the dot-com crisis), and the Great Recession of 2007-2009. The fact that nonfinancial corporate debt is again at historically high levels today may show, along with other indicators, that another crisis is imminent.
Financial Sector Debt
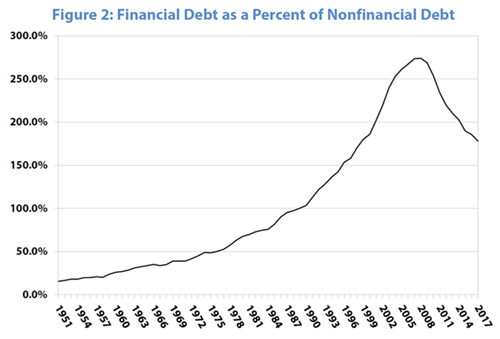
Debt in the financial sector (see Figure 2) has also grown astronomically. The difference is that debt in the nonfinancial sector--at least in part--finances actual production. Debt in the financial sector funds financial instruments that are not part of the productive economy, such as futures, options, derivatives, and other financial instruments. In 1951, financial debt was a mere 15% of nonfinancial debt. Since then, both have grown--nonfinancial debt by about 11 times and financial debt by a whopping 131 times--so that financial debt is now just short of double the amount of nonfinancial debt. At its peak in 2008 (the period of the Great Recession), it was 274% of nonfinancial debt--just short of three times. The primary reason for the relative growth of financial debt is the low rate of return on profitable investment. That fosters speculation. The decrease shown in the chart since the Great Recession has not been due to a decrease in financial debt; it has been due to the more rapid growth of nonfinancial corporate debt.
Household Debt
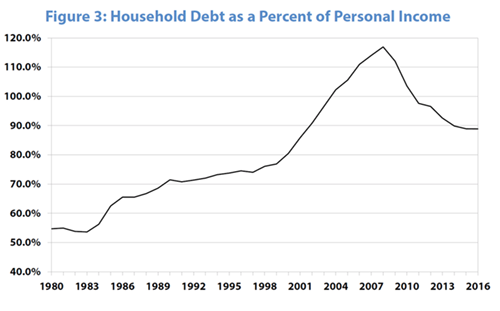
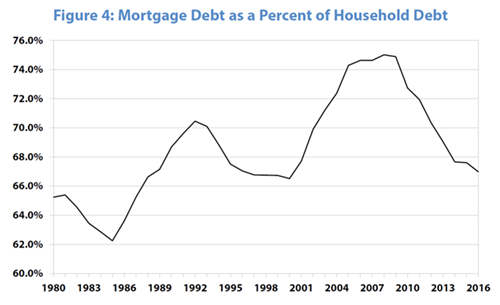
Household debt (see Figure 3) is of two types. The largest part is mortgage debt (see Figure 4) where people are buying their own houses. Almost two-thirds of households in the United States own their homes (or are paying banks for them). The rest of household debt includes credit card debt, auto loans, and student loans. The total sum of household debt--$15.7 trillion, up from $1.4 trillion in 1980--is a major load on families. The majority of that debt is mortgage debt, which is currently about $10.4 trillion. As households take on more debt, their payment obligations increase, leaving fewer funds for the necessities of life. Banks and credit card companies promote debt to increase spending, whereas households take on debt to cover their bills. Most families have no savings and the discretionary portion of household income is disappearing, so credit cards become a lifeline used in emergencies. The rising debt burden weighs households down: you can't buy more when the interest payments become too large a proportion of total household expenditures. As is shown in the charts, household, mortgage, and student loan debt as a proportion of personal income peaked at the height of the Great Recession, when people were hurting. While it has since declined, it still remains high. Total household debt is still 90% of personal income, which is historically a very high level. Mortgage debt as a proportion of total debt also peaked during the Great Recession, which was brought on by the financial crisis over the housing market. It has since fallen back to more historic levels.
Student Loan Debt
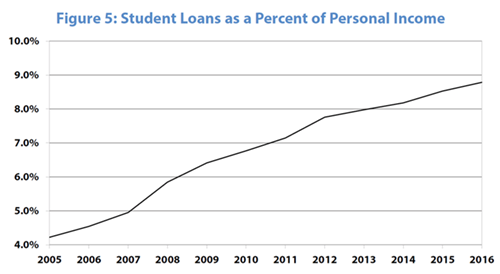
A special note needs to be made about student loan debt (see Figure 5), which currently stands at over $1.6 trillion. This is a major burden on those who have attended college and has the effect of making higher education less financially worthwhile than in the past. Education has always been seen in this country as a way to move "up and out" of poverty or the working class. Today, the increase in student debt, which has risen 235% since 2006, makes the return on education questionable. The burden of student loans--principal and interest--has increased from about 4% of personal income to almost 9%. It is almost impossible to get out from under the burden of student debt except by paying off virtually every dollar of it. Even declaring bankruptcy does not free people from this debt. Student debt also restricts productivity growth. Productivity depends in large part on the education of workers. Students are forced to take any job in order to start paying off the debt, not the one they are the most qualified for. Others are kept from getting an education because they cannot afford to take on the debt. The actual burden on students is worse than the numbers reflect, because personal income includes everyone, with or without student debt. The burden just on those with student debt is much worse, but the data to reveal that are not available.
Government Debt
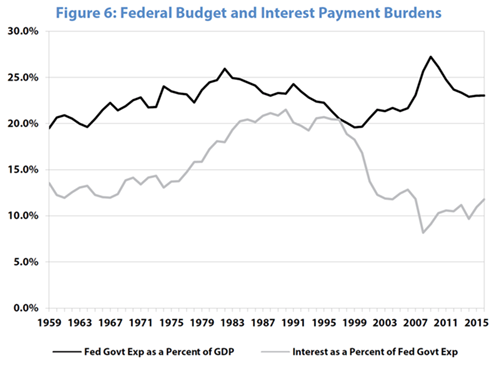
Government debt has increased dramatically over the last 20 years--by 281% or almost three times to $22 trillion--and its growth has many ramifications for the economy. The huge debt and the burden of paying it is being used by conservatives as an excuse for cutting benefits and government programs that are central to poor and working class families. But the real burden of government debt (see Figure 6) depends on its overall proportion to total government spending and to the GDP. It's not just the total size of the debt, but the ability to repay it that is important. As the top line in the chart shows, while the ratio of government spending to GDP has risen and fallen with the economy, it has not risen substantially over the last 60 or so years. As the bottom line in the chart shows, interest payments on the government debt have actually fallen as a percent of total government spending. This is due in part to the extremely low--often even negative--interest rates since the Great Recession. In short, most debt--especially government debt--is very inexpensive. While it's hard to pin down an exact percentage that is acceptable, some government debt is good, as government spending is a spur to the economy, increasing economic activity.
To the degree that it expands the money supply, government spending fosters inflation and lowers the dollar in relation to other currencies, making U.S. goods less expensive overseas and imports more expensive here. The U.S. action seems to have been countered by others, such as the European Union, which has recently again taken up quantitative easing. Quantitative easing is the expansion of the money supply by central banks; they buy bonds with cash, which goes into circulation. This pushes down interest rates, hopefully spurring investment, which becomes cheaper to finance. In Europe, quantitative easing has also lowered the euro, which tends to have the opposite effect of lowering the dollar. The increase in the money supply may also spur inflation. However, inflation has been low. Although in the United States the Consumer Price Index (CPI) understates the rate of increase in prices the average worker feels, it has been very low over the last decade: below 2% for almost all of the period. Interest rates have also been low; they are currently below 2.5%. This means that the real rate of interest--where we subtract the rate of inflation from the interest rate charged on government debt--has been very low, possibly even negative. Low real interest rates have fostered the boom in debt and borrowing because credit is cheap. It has also fostered speculation, where money capital searches for higher rates of return in more risky ventures.
Conclusion
So where does all this information leave us? In economics it is always important to ask, "who is affected?" Corporate debt affects the real economy and can have an important effect on financial markets, particularly with the stock buybacks we are seeing. Non-financial corporate debt as a percent of Gross Domestic Product is at crisis levels and is increasing. If it leads to an economic crisis, as it has in the past, that will affect us all through layoffs, bankruptcies, foreclosures, evictions, and other personal disasters. Financial debt can also create crisis because it reacts back on the real economy, restricting credit availability to firms that need it to continue operations--and that affects workers as well. The burdens of capitalist crises are always put on the backs of the working class. High levels of household debt are always difficult for working-class families, but that burden has lessened somewhat since it peaked in the Great Recession. Another economic downturn will again drive it up, further squeezing those toward the bottom of the income scale. Student debt is of particular note in this regard.
Finally, government debt, while not at crisis proportions, cuts in several directions. On the one hand, it requires greater interest payments paid by taxpayers. On the other hand, while it stimulates the economy, creating jobs and income for workers, it also creates income for the bondholders, generally a section of the capitalist class.
The debt crisis is not going to go away. Paying off the debt is not a solution. The solution is working toward a society in built on people having what they need to survive and prosper, not on debt. Debt is the sign that we do not have what we need to survive and prosper. It is a sign of weakness of capitalism as a whole--a system that cannot provide the basics of life without going trillions of dollars into debt. At the same time, debt is a huge source of profits for the banks. Debt is therefore a class question, another aspect of the conflict between capital, which profits from debt, and the working class, which is crippled by its burden.
Matt Egan, “The $6.3 trillion debt binge: American companies have never owed this much,” CNN, July 1, 2018 (money.cnn.com); Mauldin Economics, “Thoughts from the Frontline: Credit-Driven Train Crash, Part 1,” May 11, 2018 (mauldineconomics.com). Data sources: The Federal Reserve Board, The Federal Reserve of St. Louis Economic Data (FRED) and the Bureau of Economic Analysis.