We've heard it countless times in recent media accounts: The economy is at "full employment." The most recent jobs numbers, out the first week in May, show the official unemployment rate, and applications for unemployment benefits are at a 50-year low. The last time a recovery was able to push the unemployment rate to these levels was in 1969, when my mom was just entering elementary school and the United States was in the heyday of the "Golden Age" of capitalism.

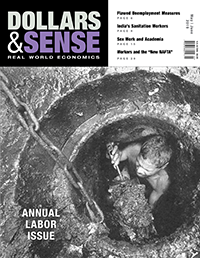
May/June 2019 issue.
But economists are puzzled. Despite low unemployment (the current rate is just 3.6%), significant wage increases remain elusive. In other words, workers aren't benefiting much. This is deeply troubling in an era of unprecedented inequality, driven in large part by decades of a falling wage share. The size of our economic pie may be getting bigger, but the wage share, or the share of the economic pie going to workers, has been contracting. Furthermore, a lack of wage growth isn't allowing for the true recovery that Main Street so desperately needs.
There could be a number of things at work which may explain the fact that wages aren't rising much, despite a low unemployment rate. For one, perhaps the relationship between wages and unemployment isn't as clear as economists previously thought. Many have criticized the Phillips Curve--a graph, or family of graphs, that supposedly shows an inverse relationship between the unemployment rate and the inflation rate--arguing that it may have been a good model at one point in history, but no longer describes our current economy.
But maybe the puzzle isn't a puzzle at all. In economics, mainstream theory claims that a tight labor market will lead to rising wages, with the largest benefits going to those at the poorly compensated end of the labor market. Rather than this relationship being broken, it's plausible that the labor market isn't actually that tight. Perhaps there's still a sizable reserve army of unemployed that would work if there were a decent paying job actually available.
Official unemployment, measured by the U-3 rate from the Bureau of Labor Statistics (BLS), is the percentage of individuals who are not employed at all but are currently looking for and available for work, as a percentage of the civilian labor force--excluding individuals who are incarcerated, institutionalized, or in the armed services. To be counted as unemployed, the person must have applied for a job within a four week period. Importantly, this leaves out large swaths of people that should be counted among the unemployed, including people who are marginally attached to the labor force and people who are only working part-time despite wanting to work full-time.
These mainstream measurements create an artificially low unemployment number. Importantly, the unemployment number is a critical indicator that informs policies across the government, including at the Federal Reserve. A misleading unemployment rate can have profound implications for the economy. For instance, if the Fed thinks the economy is at or near full employment, they may start tapping the breaks, as we saw numerous times in 2018. But broader indicators of unemployment show us this is still premature.
Alternative measures of labor market tightness, such as the employment-to-population ratio for workers in their prime working age (25-54), still haven't recovered to pre-recession levels. Other indicators, like the labor force participation rate, are more than 4% below the rate that was reached during the economic boom in the late 1990s. While some economists point to an aging population, this accounts for only about half of the decline. Yet another alternative measure is the U-6 unemployment rate, which accounts for workers marginally attached to the labor force and workers forced to work part-time due to economic reasons. This indicator shows that there is still significant slack in the labor market, with the BLS's U-6 unemployment rate (which adds the underemployed and workers who have given up looking for work to the U-3 rate) hovering around 7.3%.
The failure of the official unemployment rate to function as an adequate indicator of labor market strength is even catching the attention of economists at the White House. In the recent 2019 Economic Report of the President, economists started to question how we have long defined what it means to be "out of the labor force." Traditionally, if someone is out of the labor force, they're not counted as unemployed--and therein lies the problem.
For decades, roughly 55-65% of people who were starting new work came from outside of the labor force; today, that number is approaching 75%. That's telling us three out of four people who are just starting to work again weren't counted as unemployed before. With few new hires coming from the pool of the unemployed, it's clear that our traditional measure is not measuring true labor market slack.
Policymakers need credible indicators to inform their decisions as they attempt to fine-tune the valves which help govern the economy. Looking across a broad span of labor market data, it's clear that many people remain on the sidelines, ready and willing to work if a decent paying job were available. The relationship between unemployment and wages hasn't totally broken, but the same can't be said for our measure of unemployment.
