The Great Tax-Cut Experiment
Has cutting tax rates for the rich helped the economy?
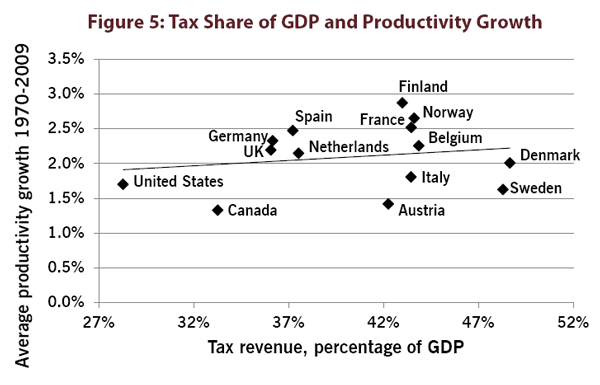
Since the late 1970s, during the Carter Administration, conservative economists have been warning that high taxes retard economic growth by discouraging productive work and investment. These arguments have resonated with politicians, who have steadily cut income taxes, especially those borne by the richest Americans. The highest marginal tax rate, which stood at 70% by the end of the 1970s, was cut to less than 30% in less than a decade. (The marginal rate for a person is the one applied to his or her last dollar of income. A marginal rate that applies to, say, the bracket above $250,000, then, is paid only on that portion of income. The portion of a person's income below that threshold is taxed at the lower rates applying to lower tax brackets.) Despite increases in the early 1990s, the top marginal rate remained below 40%, when it was cut further during the administration of George W. Bush. These dramatic cuts in tax rates, however, have not led to an acceleration in economic growth, investment, or productivity.

January/February 2013 issue.
Falling Tax Rates for the Richest: The federal government has been cutting taxes on the richest Americans since the end of World War II. The average tax paid by the richest taxpayers, as a percentage of income, is typically less than the top marginal rate. Some of their income (the portion below the threshold for the top marginal rate, any capital-gains income, etc.) is taxed at lower rates. Some is not subject to federal income tax because of deductions for state and local taxes, health-care costs, and other expenses. The decline in the average tax rate for the richest, however, does follow the cuts in the top marginal income-tax rate. (See Figure 1.)
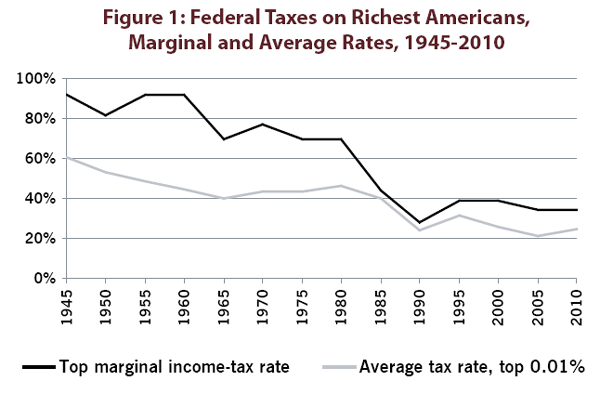
Comparisons with Other Countries: Americans pay a smaller proportion of total income in taxes than do people in any other advanced capitalist economy. As recently as the late 1960s, taxes accounted for as high a share of national income in the United States as in Western European countries. After decades of tax cuts, however, the United States now stands out for its low taxes and small government sector. (See Figure 2.)
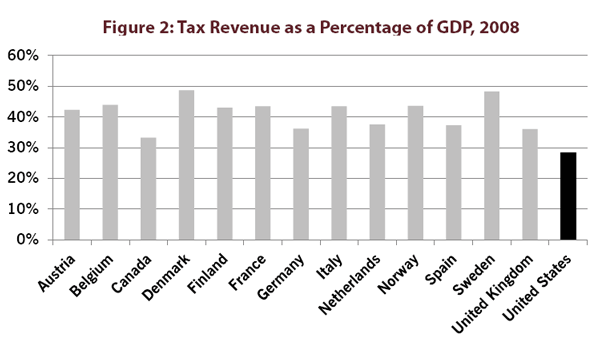
Higher Growth When Taxes Are Higher: On average, the economy has grown faster during presidential administrations with higher tax rates on the richest Americans. Growth was unusually slow during George W. Bush's two terms (Bush II) and during Obama's first term, when the Bush tax cuts remained in effect. On average, every 10 percentage-point rise in the average tax rate on the richest has been associated with an increase in annual GDP growth of almost one percentage point. (See Figure 3.)
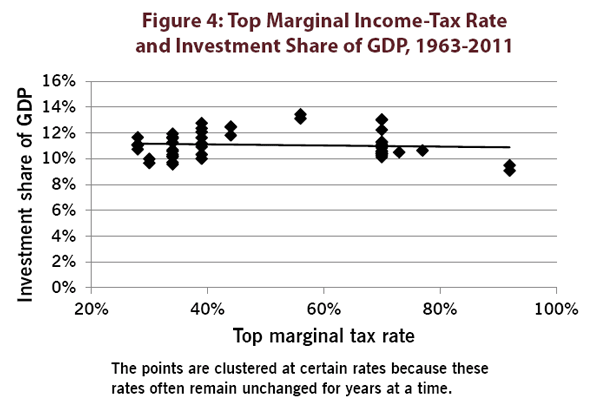
Declining Tax Rates Haven't Stimulated Investment: Cutting taxes on the richest Americans has not led them to invest more in plant and equipment. Over the past 50 years, as tax rates have declined, there has been no increase in investment spending as a percentage of GDP. (The flat trend line shows that changes in the highest marginal income-tax rate have not affected investment much, one way or the other.) Instead, the investment share of the economy has been determined by other factors, such as aggregate demand, rather than tax policy. (See Figure 4.)
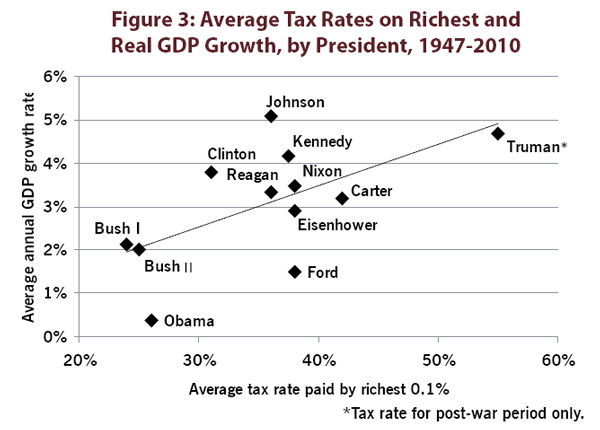
Lower Taxes, Slower GDP Growth: Despite lower and declining tax rates, especially on the rich, the United States has had slower productivity growth over the last several decades than other advanced economies. Overall, lower taxes are associated with slower growth in GDP per hour worked. A 10 percentage point increase in taxes as a share of GDP is associated with an increase in the productivity growth rate of 0.2 percentage points. (See Figure 5.)
